Some mortgage delinquency data raised concerns, but Cotality’s Q2 report also showed a positive sign: late loans aren’t progressing to more serious stages.
The total delinquency rate rose on a quarter-to-quarter basis for the period ended June 30, trending higher after a drop-off for the period ended March 31, the Loan Performance Indictors report said.
On an annual basis, the overall delinquency rate declined to 2.9% from 3%. But in the third quarter last year the rate was also 3%, while in the fourth quarter it climbed to 3.1% before dropping back down to 2.8% for the first quarter.
“Overall, while delinquency rates remain historically low, regional pockets — such as the District of Columbia and select metro areas — are showing signs of upward movement, and recent increases in unemployment could put further pressure on borrowers in the months ahead,” said Molly Boesel, senior principal economist at Cotality, in a press release. “However, it is encouraging that delinquencies have not advanced to more severe stages.”
How did delinquency rates change?
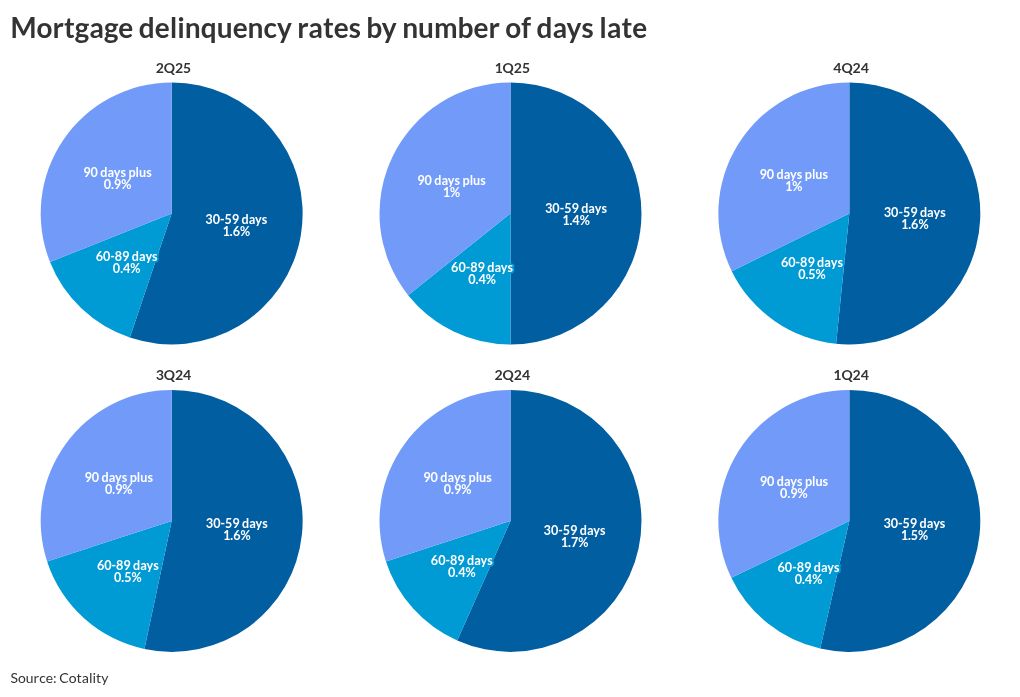
The serious delinquency rate, mortgage payments which are 90 days or more past due plus those already in foreclosure, remained at 0.9% compared with the second quarter of 2024; in the first quarter, it was at 1%.
The next bucket, mortgages between 60 days and 89 days late remained at 0.4% versus both the first quarter and one year ago.
But on a quarter-to-quarter basis, early stage delinquencies, between 30 and 59 days past due, rose by 0.2 percentage points to 1.6% from 1.4% in March. Year-over-year, the rate fell 0.1 percentage points.
The transition rate, measuring the shift from a borrower being current to a 30-day late situation, was 0.6% for the second quarter, down from 0.9% one year prior.
While the foreclosure rate ticked up in June, Cotality noted it continues to hover within its five-year range of 0.2% to 0.3%, which suggests that most borrowers are finding a way to avoid losing their homes despite financial pressures.
How delinquency rates vary among localities
On the state level, the District of Columbia had a 0.6 percentage point annual increase in the delinquency rate. Meanwhile, seven states — Florida, California, Minnesota, Oregon, Utah, Wisconsin and Georgia — were all in the range of 0.1 percentage points higher.
But at the metro level, 27%, or 104 of the 384 cities Cotality tracked had an annual increase in the rate of late payments. Farmington, New Mexico led the way, up 1.0 percentage points.
Worse, double this percentage, 54%, 207 metro areas, had an annual increase in the serious delinquency rate. This being said, Asheville, North Carolina, the city with the largest increase at 0.6 percentage points, was extremely impacted by Hurricane Helene last fall.
A trio of Florida cities had a 0.5 percentage point rise in the serious delinquency rate: Tampa-St. Petersburg-Clearwater; Lakeland-Winter Haven; and Punta Gorda. The other metros with this size increase were Lawton, Oklahoma; Wichita Falls, Texas; and Augusta-Richmond County, which straddles Georgia and South Carolina.
Which counties have the riskiest housing markets?
Meanwhile, Attom’s second quarter Housing Risk Report found a significant number of counties in the South at both the high and low ends of the list of housing markets most in danger of issues.
Of the 50 riskiest counties, 21 were in the South, followed by the West, with 18; in particular California has significant representation, 14 counties. Like the Asheville area suffering from hurricane-related distress, real estate in much of California has been impacted by wildfires.
Attom’s criteria included affordability, proportion of seriously underwater mortgages, foreclosures and county unemployment rates.
The riskiest county is Charlotte County in Florida, where Punta Gorda is located. This was followed by three California counties: Humboldt, Shasta and Butte. Cumberland County, New Jersey was ranked fifth.
While median home sales price and home affordability metrics were different between the five, all reported unemployment rates above June’s non-seasonally adjusted national average of 4.36% and foreclosure ratios of at least one in every 766 homes.
“This summer’s home prices were certainly eye-catching, but there are many factors that contribute to the health of a local housing market,” said Rob Barber, CEO of Attom, in a press release. “There’s uncertainty about how long prices can keep going up, and what will happen with the broader economy.”
On the other hand, 18 counties in the South, and the same number in the Northeast, were on the list of most favorable.