
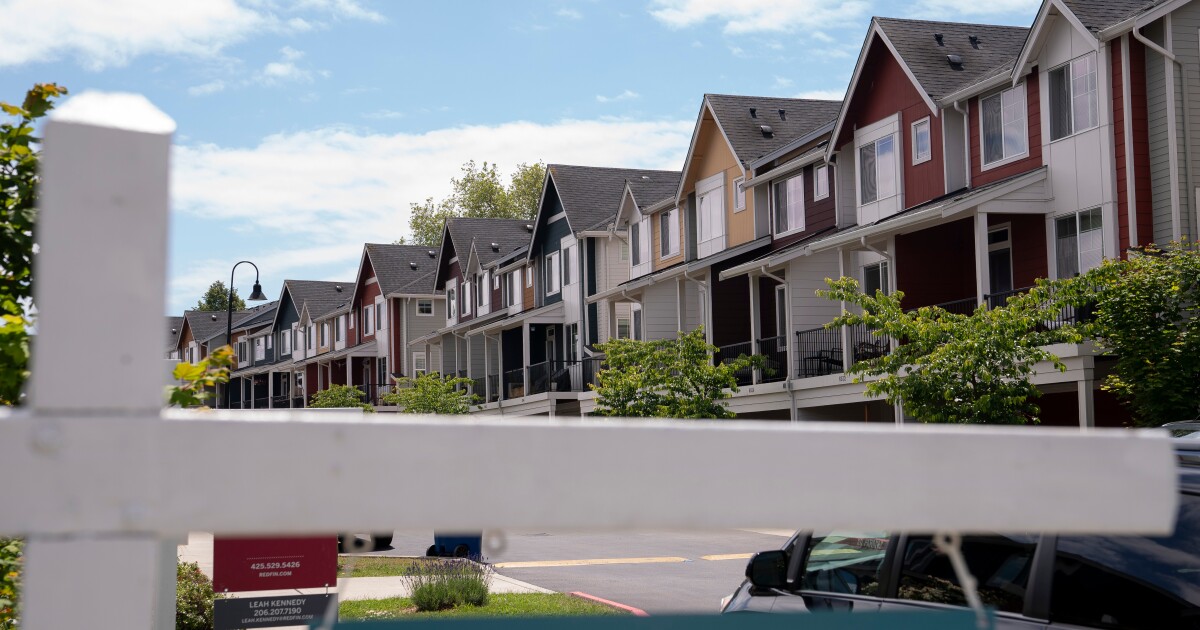
Among the nation’s 50 largest metro areas, half, primarily in the north and east, had annual home price increases in July, while the others are reporting downturns, Zillow found.
Nationwide, year-over-year home price appreciation was a meager 0.2%. While this helped to marginally improve affordability, with average monthly mortgage costs down $19 over the past year, it is still nearly $1,000 per month more than prior to the pandemic, Zillow calculated.
“Perhaps more than ever, whether it’s a good time to buy depends on where you live,” said Kara Ng, senior economist at Zillow, in a press release. “A defining trait of this market is that buyers are gaining leverage that most of them can’t use, because cost barriers are too high.”
The typical home value is $367,695, with a typical mortgage payment at 80% loan-to-value ratio at $1,907. This compared with $367,369 in June.
Which cities are good for home buyers?
Out of the 50 markets ranked, only seven are considered favorable to buyers: Miami; Atlanta; Tampa, Florida; Austin, Texas; Jacksonville, Florida; Memphis, Tennessee; and New Orleans. Out of the top 50 metros, 27 are considered to be in the buyers’ favor or neutral. This is up from 24 in June.
San Francisco leads the five strong sellers’ markets, followed by Providence, Rhode Island; Milwaukee; Hartford, Connecticut; and Buffalo, New York.
Meanwhile, nationwide, sellers cut their prices on 27.4% of listings during July, which is the highest share since Zillow began tracking this metric in 2018. In June, the share was 26.5%.
Reductions were more common in the South and Mountain states. But in the Northeast and on the West Coast, they were not as widespread, Zillow said.
What was the increase in days from listing to sale?
Homes which sold in July, did so in an average of 24 days in July, six days slower than in 2024, although just one day longer than prior to the pandemic.
However, Zillow noted that the median lifespan of all listings on its site was 60 days for the month, four more than the pre-pandemic average; Zillow started collecting this data in 2018.
A separate report from Redfin, put the time a typical home went from listing to contract as 43 days for July, up from 35 days one year earlier. It is the longest timespan for any July since 2015.
Pending home sales fell 1.1% month-over-month to the lowest seasonally adjusted level since November 2023, Redfin said. Existing-home sales ticked down to a seasonally adjusted annual rate of 4.15 million units, which it said was the lowest level in nearly a year.
“Supply is starting to fall because prospective sellers are choosing not to list after seeing their neighbor’s home linger on the market or sell for below the asking price,” said Redfin Senior Economist Asad Khan in a press release. “Some existing sellers are also pulling their homes off the market, opting instead to rent their house out or hold off on a move altogether — especially if they bought at the peak of the pandemic market and are worried about taking a loss.”
Redfin’s data found median home sales prices increased 1.4% annually in July to $443,867; this is the highest dollar amount for the month on record. This was up from a 0.9% annual increase in June and 0.7% for May and a turnaround from shrinking prices at the start of the year.
Home prices decline from June to July
First American Data & Analytics’ own Home Price Index for July found prices rose by 1.5% annually in July, the slowest pace since March 2012. Between June and July, prices were down by 0.2%; this followed a revised 0.2% decline between May and June.
“It’s back to reality for national house price appreciation, as limited affordability, economic uncertainty and homeowners unwilling to enter the market and give up their low mortgage rates hinder demand amid a growing inventory of listings,” said Mark Fleming, chief economist at First American, in a press release.
Annual price growth slowed for the eighth straight month as the supply versus demand dynamic continued to shift, he continued.
First American is seeing similar regional variations as Zillow is.
“Whether a market is gradually shifting towards a buyer’s market or remains firmly in sellers’ market territory depends on which side of the local supply demand tug-of-war is gaining momentum,” Fleming added.


