
U.S. homeowners saw their available equity pull back in the third quarter, contributing to an upward creep in the percentage of underwater mortgages, according to a new report.
Approximately 2.8% of mortgaged properties in the country were considered seriously underwater during the quarter, maintaining a year-long trend, according to real estate data provider Attom. The share rose from 2.7% in the prior quarter and 2.5% one year ago.
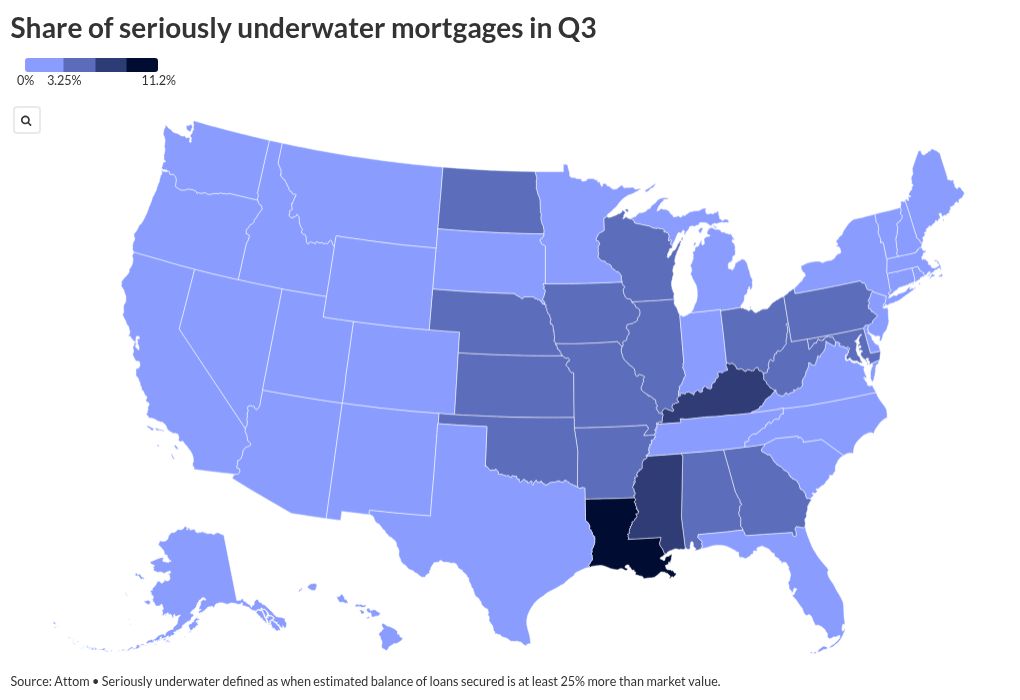
Homes are considered seriously underwater when the unpaid balances of loans secured by their property are 25% higher than estimated market value.
The upward climb coincided with overall declines in home equity reported by the real estate intelligence firm. The percentage of homes whose value exceeded outstanding mortgage balances by 50% or more, came in at 46.1%. The share dropped when compared to this year’s second quarter level of 47.4%. Twelve months earlier, the share was at 48.3%.
Still, the recent changes are not equivalent to unhealthy homeowner finances in the country.
“After several years of strong equity growth that peaked in 2022, homeowner equity levels appear to be stabilizing. The modest fluctuations seen over the last few quarters may suggest a housing market that’s finding balance after an extended period of appreciation,” said Attom CEO Rob Barber in a press release.
The rise in underwater loans, though, remains a pain point mortgage lenders are keeping an eye on for signs of growing homeowner stress. While national mortgage delinquency rates eased over the summer, the rate of late payments exceeding three months point to segments running into serious financial distress. Of concern is the status of some Federal Housing Administration mortgage holders who appear to be struggling.
While underwater mortgage rates are creeping higher, they are yet to approach levels seen after the Great Financial Crisis.
At the end of 2013, 19% of all properties with a mortgage were seriously underwater, according to Realtytrac, the forerunner of Attom Data Solutions.
Further hints of consumer stress this year have shown up in property tax delinquency levels, calls for foreclosure assistance and payment activity for other types of credit.
What’s behind decreased home equity?
The pullback in home equity levels appears as housing price indicators report nationwide flattening or even monthly decreases throughout 2025 despite median values hitting all-time highs.
Year-over-year average home values continue to increase, but at a slower pace compared to earlier this decade. House prices dropped across the U.S. by 0.1% from June to July, but headed up 2.3% annually, according to the Federal Housing Finance Agency.
Meanwhile, similar losses in home equity this year have shown up in research from other data providers, including Cotality.
Despite the contraction, homeowners today have plenty of tappable equity available to them thanks to a years-long surge in property values, with amounts still sitting at or near record levels.
Where underwater rates increased the most
As with home price trends, changes in home equity accrual and loss varied greatly by region during the most recent quarter. A majority of homeowners in the country with more than 50% equity were concentrated in 37.8% of U.S. ZIP codes.
Regions seeing regular month-to-month drops in home prices in FHFA’s 2025 data — Mountain, Southern and Mid Atlantic — were also more likely to post falling equity.
Florida saw the largest dip in high-equity properties by homeowner share compared to last year with a drop from 52.5% to 46%, followed by Arizona, Colorado, the District of Columbia and Georgia. Overall, the percentage of high-equity properties fell in 71.8% of metropolitan areas with populations above 500,000 over the quarter and 77.3% year over year.
Largest gains in the percentage of homes with 50% or more equity were scattered across the country, led by Alaska, Illinois, New Jersey, New York and Connecticut.
Attom also noted a rise in the underwater share of mortgages in 35 states quarter to quarter and in 46 compared to the same three months in 2024. The District of Columbia saw the biggest year-over-year growth from 3.3% to 5.1%. Maryland, Louisiana, Georgia and Oklahoma followed.
Louisiana also landed in the “top” spot in terms of total share of underwater properties relative to the state’s total mortgage volume with 11.2%, followed by Mississippi and Kentucky at 6.6% and 6%.


